
By Charles Moreira
The business intelligence (BI), analytics and corporate performance management software market is lucrative and growing.
According to Gartner, the market was worth US$12.2 billion worldwide in 2011, up 16.4% from US$10.5 billion in 2010, and SAP led the pack with 23.6% global market share in 2011 and revenue of US$2.88 billion. Oracle was second in 2011 with US$1.9 billion, SAS Institute (US$1.5 billion), IBM (US$1.47 billion), Microsoft (US$1.05 billion) and others (US$3.36 billion).
Among these SAP’s share grew 0.6 percentage points over 2010, IBM’s grew 0.5 percentage points and Microsoft’s remained the same at 8.7%, while the rest saw their share decline.
However, all the top five and other vendors saw their revenue grow in double digits from 2010, with IBM’s revenue up 20.9%, SAP’s up19.5%, Oracle’s 16.3%, Microsoft’s 16.0%, SAS Institute’s 11.3% and the rest 14.8%.
“The Asia Pacific region, including Japan, India and Pakistan accounted for 18% of this global market in 2011 and grew by 31% over 2010,” Kurt Bilafer, SAP Asia regional vice-president for Analytics told the SAP BI 2012 conference at the Marina Bay Sands Convention Centre in Singapore on 16 October, 2012. Twenty per cent of SAP’s 60,900 employees worldwide are based in the region.
 |
| From left: SAP’s Adam Binnie and Kurt Bilafer |
“Business intelligence (BI) refers to technologies for giving information to people, while business analytics (BA) comprise technologies for achieving change in organisations. It’s also about humans and how they think & feel,” said Adam Binnie, SAP Canada, Business Analytics global vice-president and general manager for Business Intelligence.
BI is believed to have made its début in 1951 as a decision support system (DSS) and according to Gartner, the term was coined in 1958 by IBM researcher Hans Peter Luhn who used it in an article in IBM Journal.
However, DSS only became popular in the 1980s, and it was only in the mid-1990s that BI began to emerge as an umbrella term to cover software-enabled innovations in performance management, planning, reporting, querying, analytics, online analytical processing, integration with operational systems, predictive analytics and related areas.
BI helps organisations obtain answers to questions such as “what happened?,” “why did it happen?,” what is happening now?” and “what might happen?” based upon their existing repositories of data and today, the huge volumes of user and public-generated unstructured data such as Twitter tweets, Facebook postings, e-mail messages, comments on websites, monitoring of user behaviour, sentiment and so on to be able to make decisions almost immediately, rather than have to wait weeks or months for the results.
According to The Data Warehousing Institute, the simplest form of BI involves query, reporting and search organisations find out what happened, while the most complex and valuable to organisations is predictive analytics which help them accurately predict what might happen.
For example, instead of the traditional way of relying on Nielsen TV viewership survey results, broadcasters now prefer to monitor what viewers are saying on Twitter, Facebook and so on, and over the next five to 10 years, they will be working to find more actionable data.
“Also, the University of Texas found Twitter results to be more accurate than traditional exit polls, which are asked who they voted for,” said Bilafer, “while studies show a US$10.40 return on investment for every dollar spent on analytics.”
Mobile analytics
SAP’s BusinessObjects Mobile application extends analytics to handheld devices such as the Apple iPad, and thus analytics’ scope to the edge of an organisations’ information system.
For example, an analytics application on an iPad uses augmented reality to show high-traffic areas in a store, popular products which need to be restocked soon, slow-moving products and so on based upon ongoing sales records being captured, and it lets them drill down for further information.
T Mobile uses an SAP solution is also used to monitor the location of people in an airport terminal by the location of their smartphones, and to observe how long they spend lingering in the corridor outside the stores. Such a system lets a store lure customers away from its competitor by sending the visitor a 50% discount voucher to their phone.
Also, a chip embedded in a pair of running shoes monitors its usage and when the shoes are likely to wear out, it sends a discount coupon to the owner to encourage him or her to buy a new pair of the same brand.
The fashionwear chain Zara uses an iPad application which lets users take an image of an item from their catalogue and say they like it. It could be an unusual item such as green coloured shoes and Zara will make them available when there are enough customers who want it, and it will inform them via e-mail when its available.
SAP and the City of Boston, collaborated on developing Citizen Insight, an iPad-based dashboard to SAP BusinessObjects Strategy Management. It lets the city fin out what its citizens think and feel, and to also let them know what the city government is doing.
Regional scene
 |
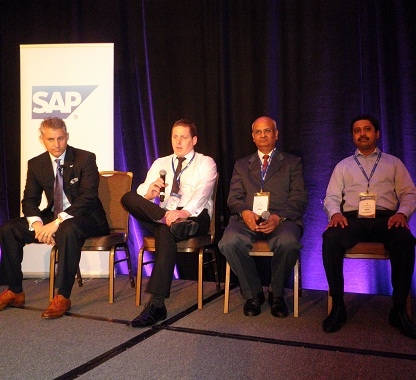
| (L-R): Kurt Bilafer, MMG Ltd’s Chris New, Bharat Petroleum’s R. Narayanan and Olam International’s N. Muthukumar |
SAP’s Asia-Pacific customers who spoke at BI2012 include Bharat Petroleum, an oil & gas company in Mumbai; Olam International, a Singapore-based integrated supply chain manager handling 20 agricultural products and food ingredients across 65 countries; and Melbourne-based metals mining company MMG Limited with mining operations in Australia, Laos, the Congo and Canada.
“We are currently in the process of deploying an SAP mobile analytics solution which lets our employees in the field get a quick snapshot of problems in a remote area and it has benefited us in terms of more efficient asset utilisation, safety and more,” said Chris New of MMG, and since our executives are running around with mobile devices, they help to drive change throughout the organisation.”
While a pothole in a mining road may seem trivial to many, over time it can damage a heavily laden mining truck carrying ore and the system helps MMG patch the pothole before it causes further damage.
“We use SAP for corporate governance, risk management and software solutions and implemented SAP BI in 2002,” said R. Narayanan, Bharat Petroleum deputy general manager. “Unfortunately, people see governance, risk and compliance (GRC) solutions as a cost but it is a necessity.”
“We have so far deployed SAP BusinessObjects Planning and Consolidation (BPC) in eight out of our 65 geographies,” said M. Muthukumar, Olam senior vice-president and head of corporate affairs. “BPC provides people with information in real time to help them make decisions quickly.”
New additions
In conjunction with BI2012, SAP launched Feature Pack 3 for BusinessObjects 4.0 BI Solutions – including SAP BusinessObjects BI, EDGE edition for small-to-medium enterprises (SMEs) and release 1.0.1 of SAP Visual Intelligence software which helps organisations take full advantage of their data resources. It also announced the SAP Analytics Plus Programme in the region.
The EDGE edition provides updates in several areas. One being to give mobile workers direct access to critical reports and metrics, and to collaborate with their colleagues, all in self-service fashion. Besides the iPad, it also now supports access on Android devices and mobile BI for the iPhone.
It also supports more handling of big data, including support for Apache, Hadoop and deeper support for the SAP HANA platform to enable high-performance analytics on petabytes of data to provide more valuable information and faster decision making.
SAP BusinessObjects Explorer provides a simple and intuitive user experience in obtaining immediate, interactive access to data, create visualisations and answer business questions on the fly.
Integration between the SAP StreamWork application and BI documents brings together people, information and business methods for fast, meaningful results.
Also, deeper SAP application integration lets customers run operational reporting of of the SAP ERP application and multiple sources, while its access to the SAP NetWeaver Business Warehouse application across all clients reduces total cost of ownership and complexity.
Rel. 1.0.1 of the SAP Visual Intelligence desktop BI solution lets people use data from Microsoft Excel spreadsheets and CSV (comma-separated variable) files. It also works with BusinessObjects Explorer for read and write integration with data from SAP HANA, while its SAP StreamWork connectivity for better BI collaboration.
It allows non-technical employees across an organisation easily visualise data and make key decisions based upon their findings without having to rely on IT services.
SAP had acquired BusinessObjects on 15 January, 2008 and its Analytics Plus programme lets earlier BusinessObjects customers in the region trade-in their existing licenses for the latest release of BusinessObjects Business Intelligence 4.0 Suite and enjoy its latest benefits to their business.